Most operations directors know that the way their plant handles PDAs, scanners, picking tools and PPE isn't working. They see it every day: devices that can't be found, shifts that start with dead batteries, supervisors acting as middlemen. What very few of them know is how to measure the gap between where they are and where they should be.
Not every plant starts from the same point, and not every plant needs the same levers. Some don't even have a record of who is using each device; others have Excel spreadsheets that nobody checks; a handful already operate with full traceability. The problem is that without a frame of reference, it is impossible to know what level your plant is at, what the next realistic step looks like and what return you can expect from each improvement. This article presents a maturity model designed specifically for the management of operational assets in industrial environments, with measurable indicators for each level, the levers that unlock the transition to the next one and the mistakes that keep most plants stuck at the bottom.
An operational asset management maturity model is a framework that classifies industrial organisations by their actual ability to control, measure and optimise the lifecycle of the assets their workers need to do their jobs: handheld devices, picking tools, personal protective equipment, scanners and any physical resource that moves between shifts and people.
Unlike traditional asset management maturity models (ISO 55000, PAS 55), which focus on fixed capital assets (machinery, infrastructure, facilities), this model targets high-turnover operational assets — those that are handed out, returned, charged, broken and lost on a daily basis. These are the assets that the ERP purchases but doesn't track, that the WMS ignores and that the shift supervisor manages from memory.
The framework we propose is built around four levels, each defined by observable and quantifiable indicators.
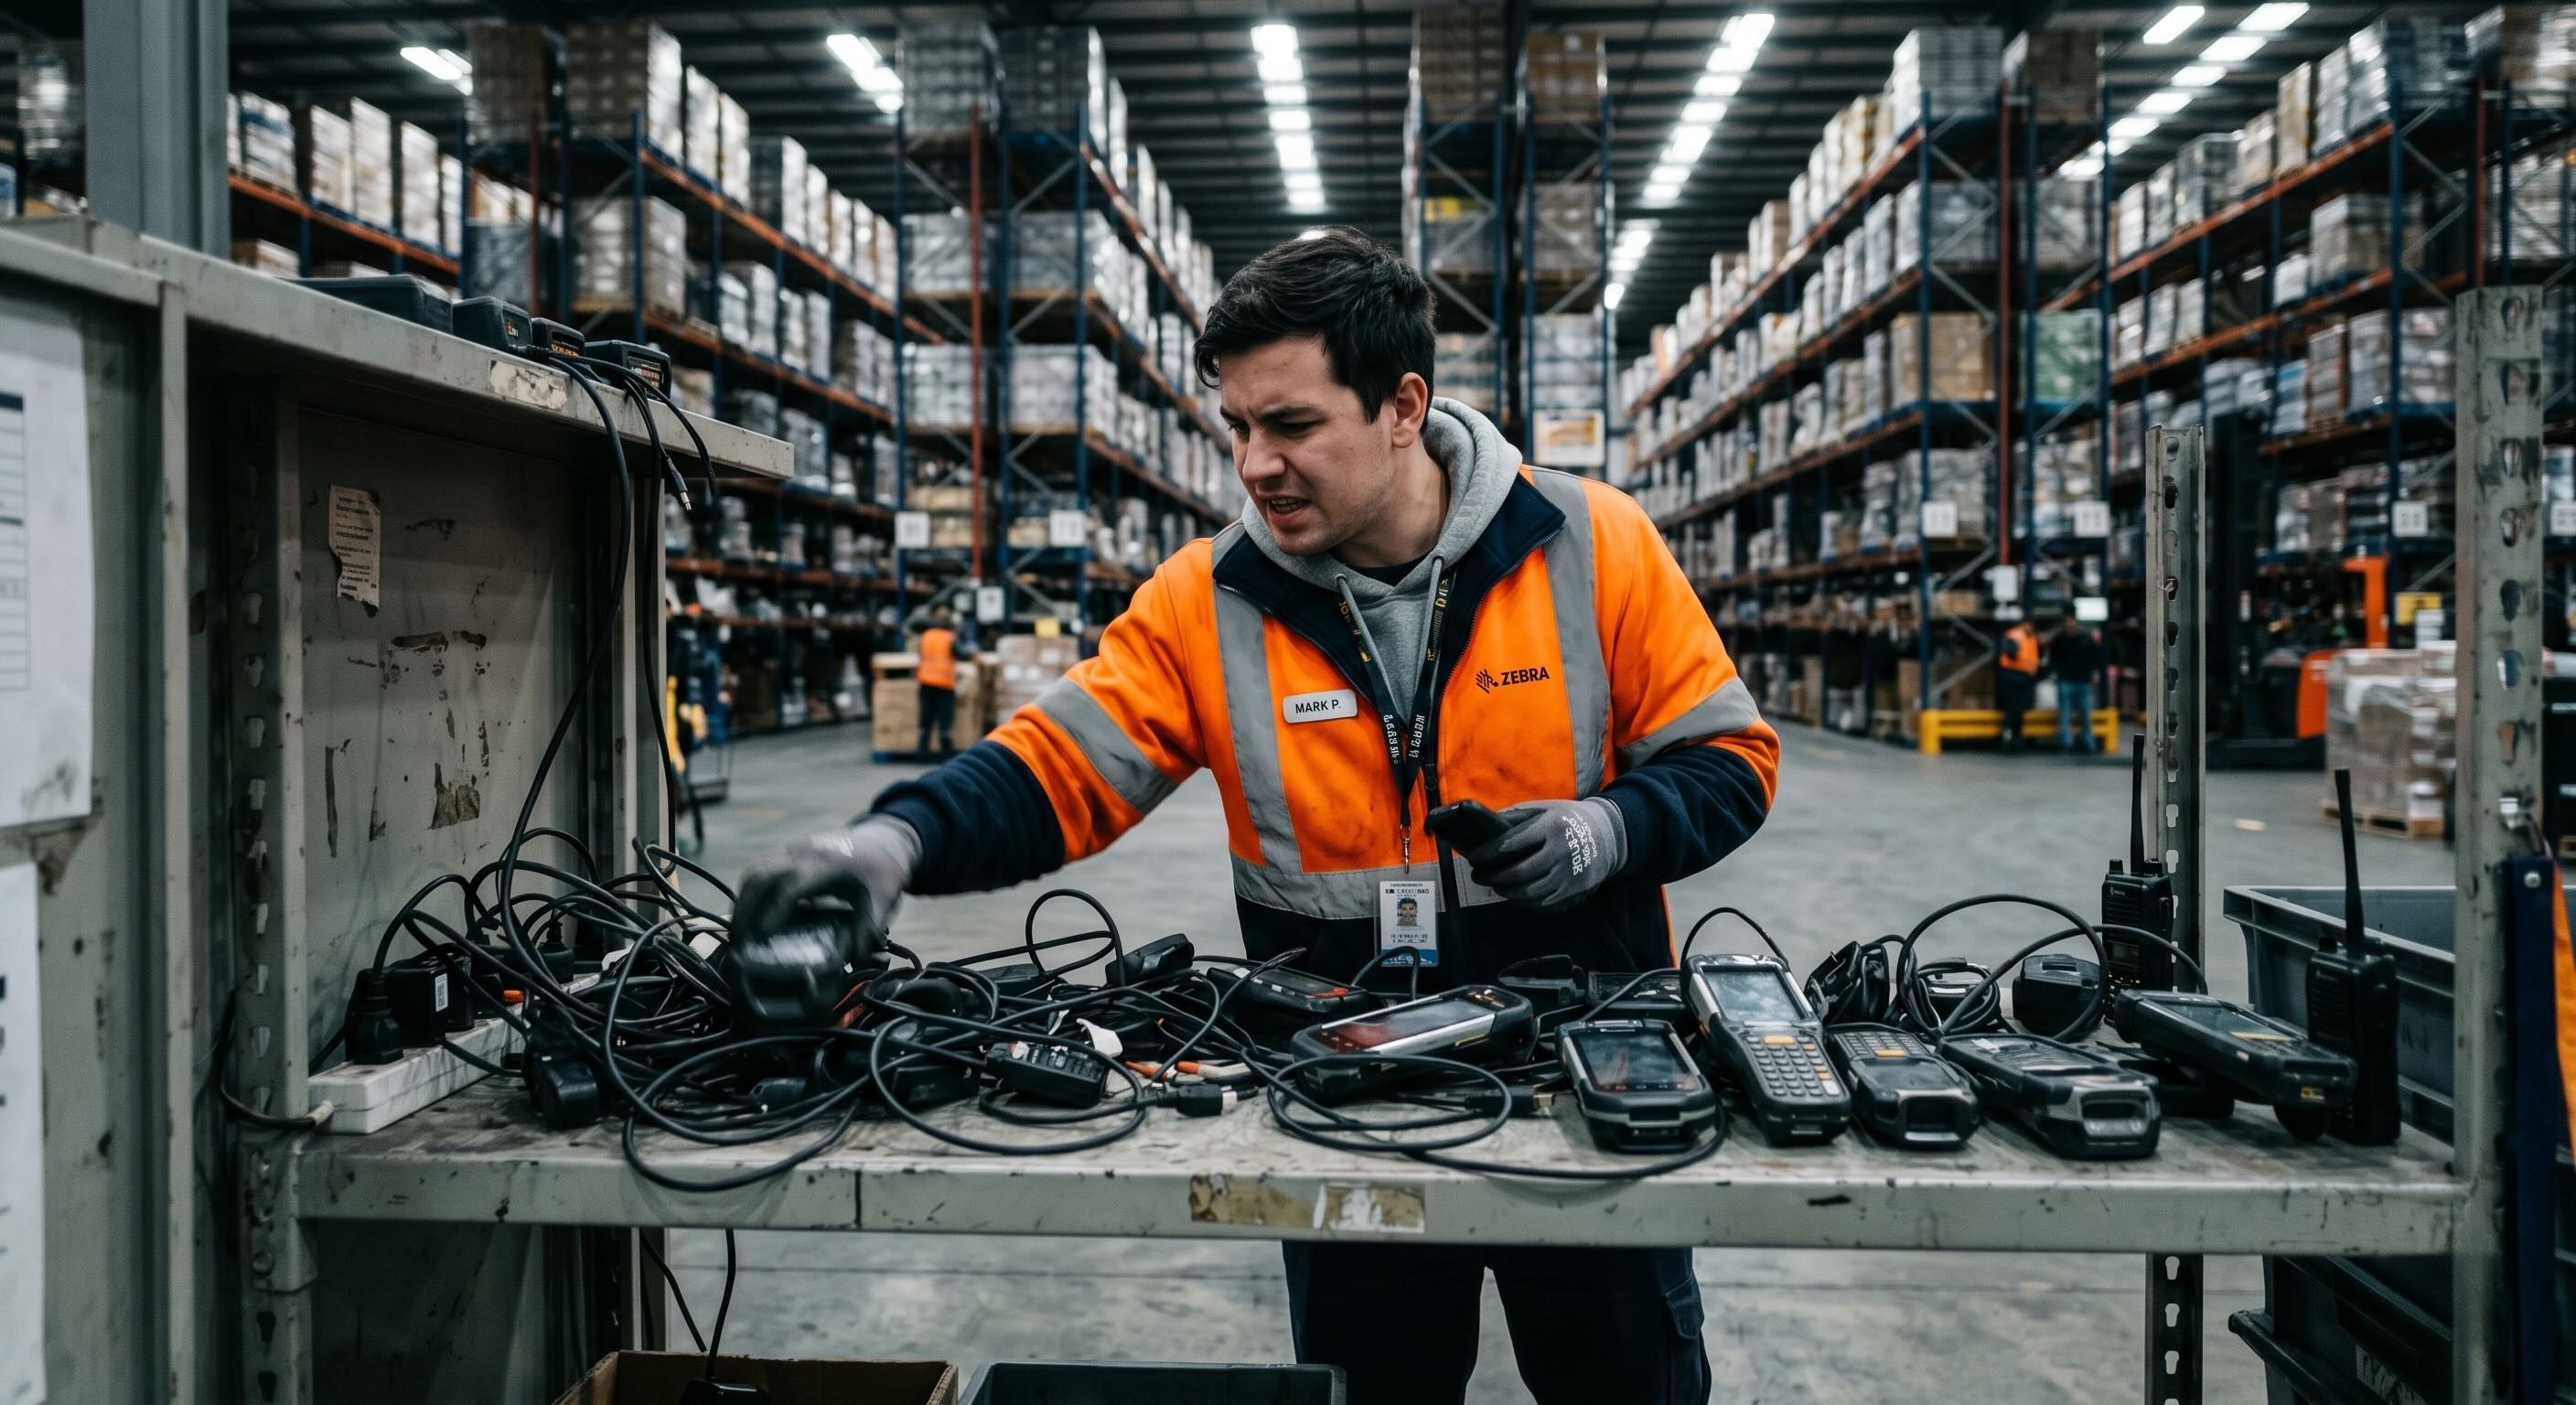
The plant manages assets with no defined process. Equipment is stored on open shelves, in shared cabinets or in communal areas with no access control. There is no individual assignment: workers grab whatever they find available.
Observable indicators at this level:
Every shift begins with an informal search for equipment. Workers spend the first minutes locating a working device, asking colleagues or negotiating who uses what. There is no record of who holds each asset, so when something disappears, no one can determine the last user or the moment of loss.
Issues are discovered by the next user: a scanner with a cracked screen, a PDA with a dead battery, deteriorated PPE. The worker who caused the damage or drained the battery has already finished their shift. There is no reporting loop, so defective equipment goes back on the shelf and resurfaces as a problem on the following shift.
Replacement purchases are made by volume, not by data. The procurement manager orders "20 more PDAs" based on the perception that there aren't enough, not on an actual loss record. The typical result is an asset pool that is oversized in purchases but undersized in availability.
Benchmark: According to operational analyses across the sector, plants at the reactive level show asset availability rates below 60% at shift start and annual loss rates above 15%.
What keeps plants trapped here: The perception that the problem is minor. "We lose a few PDAs" doesn't appear as a line item in any financial report. The cost is spread across procurement, downtime and incident management, and no single department has the full picture.
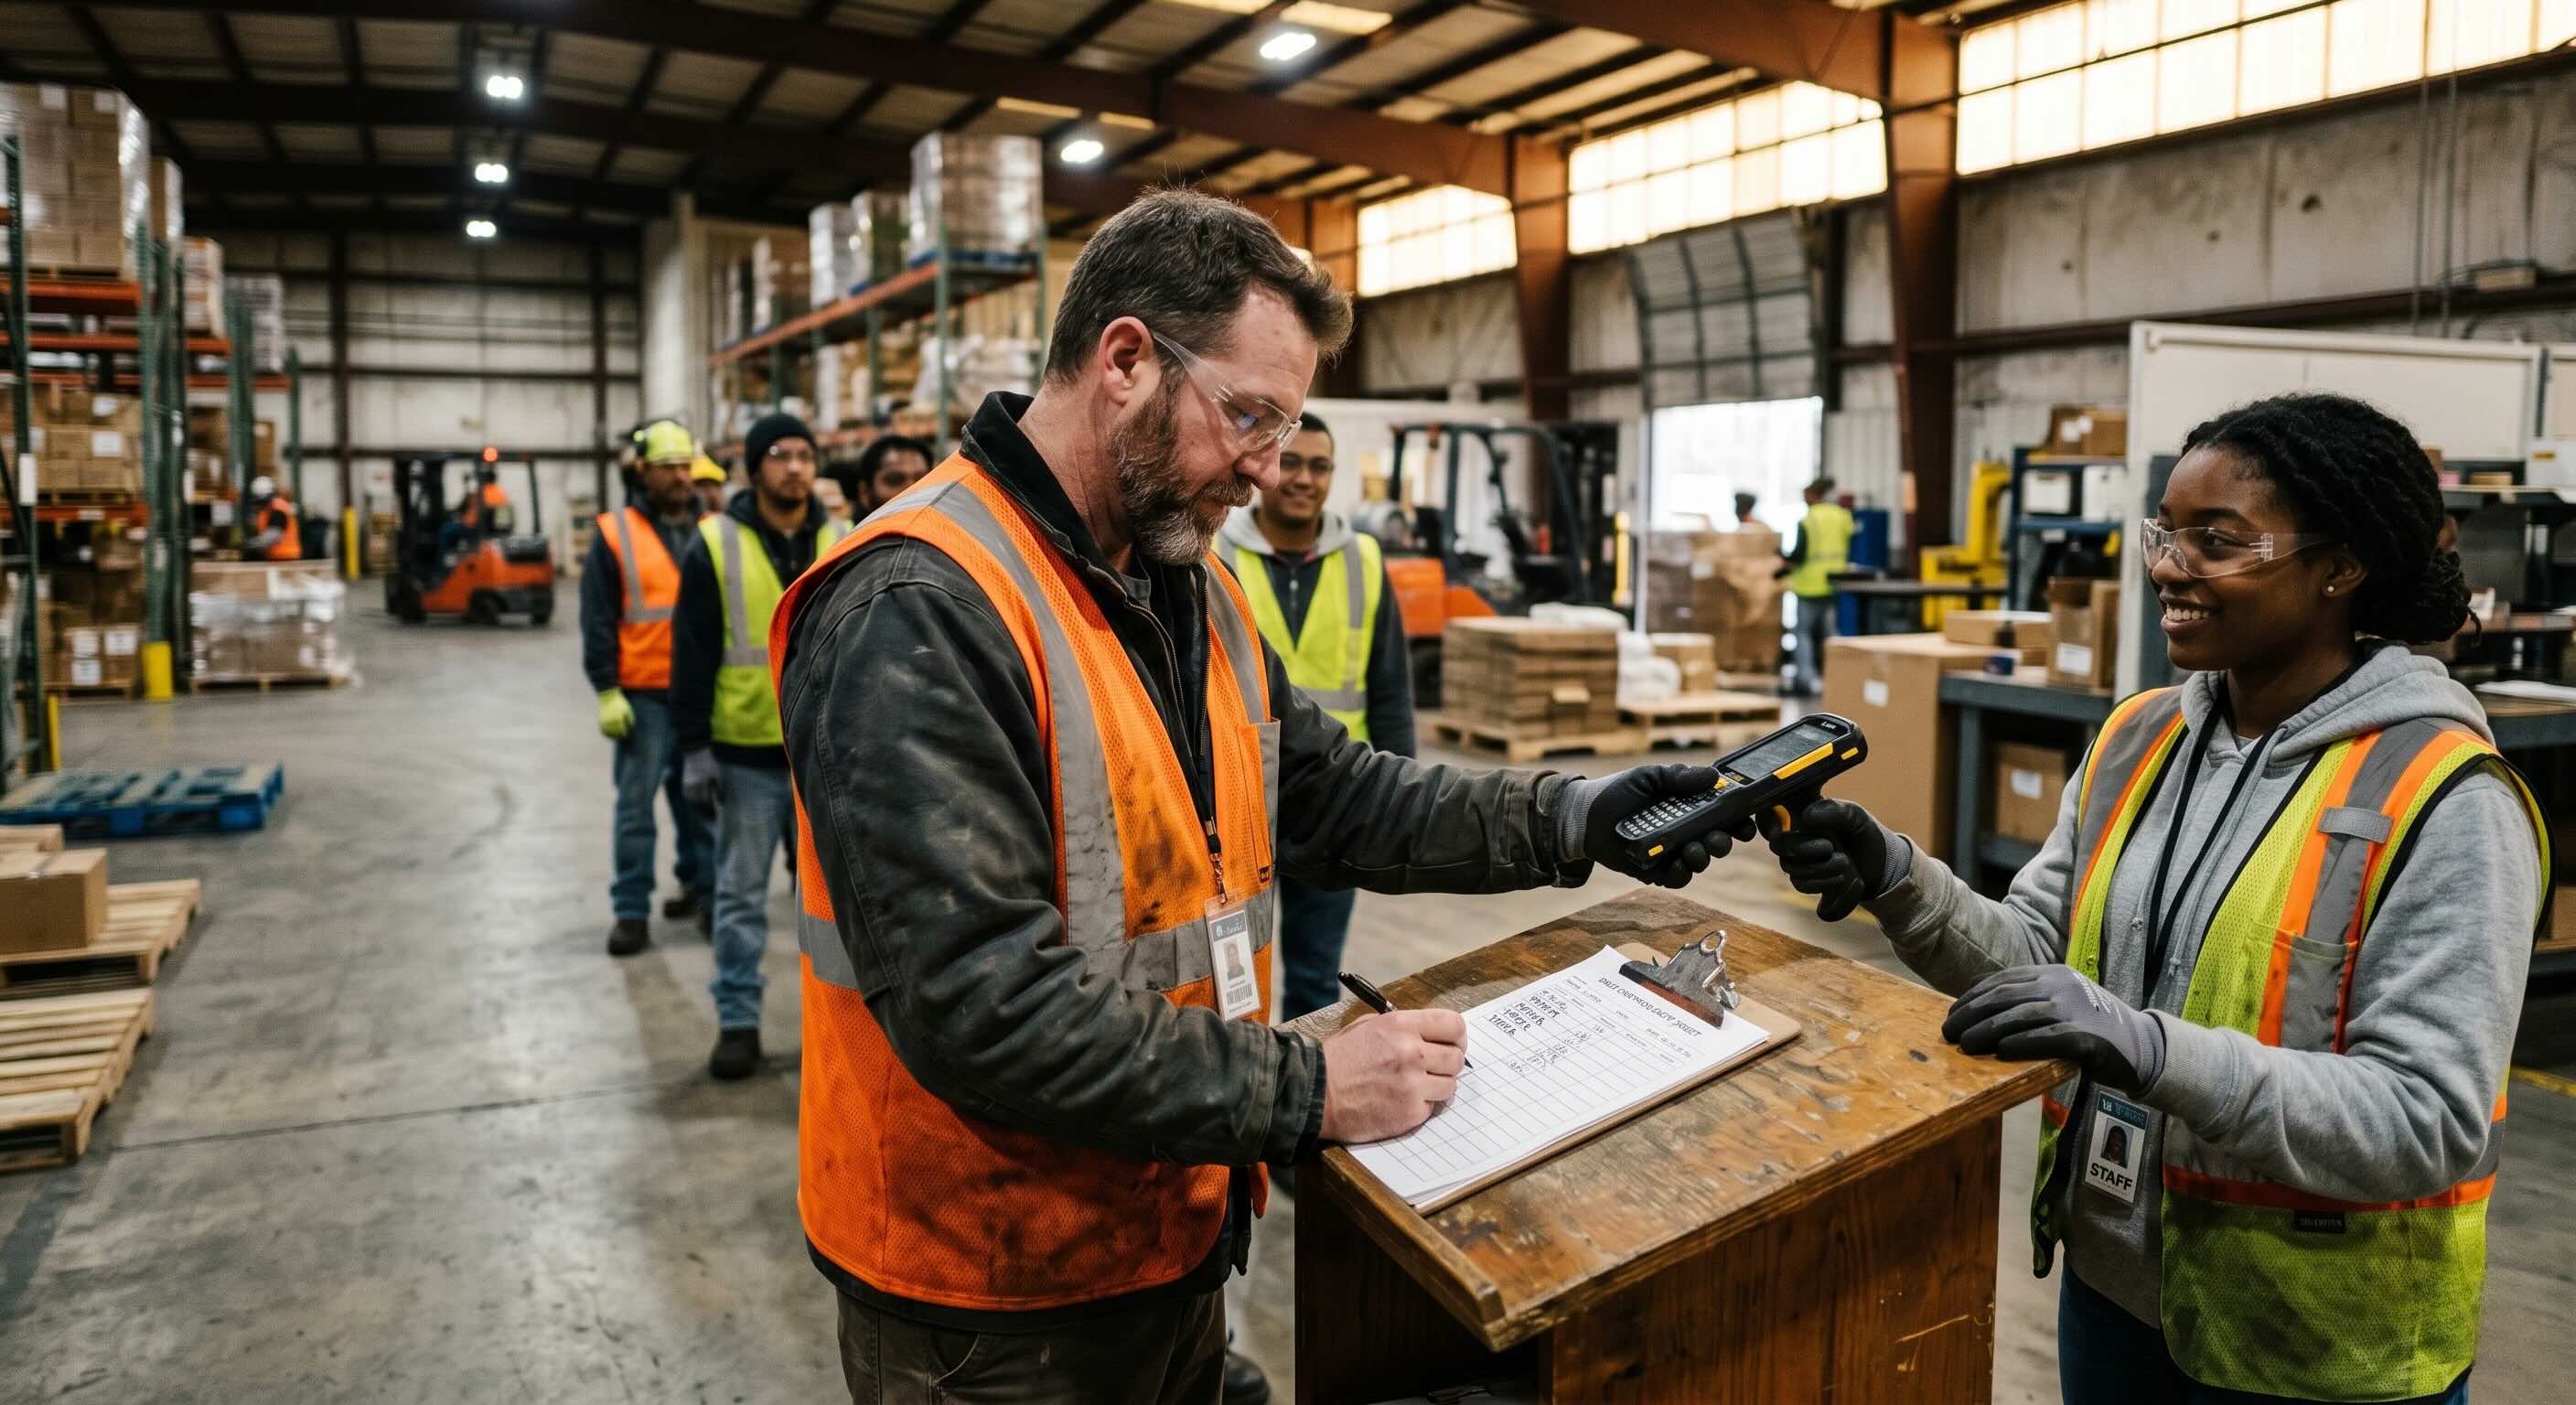
The plant acknowledges the problem and attempts to solve it with manual processes. Paper sign-out sheets or Excel templates exist where workers are supposed to record equipment collection and return. A shift supervisor is responsible for managing the handover.
Observable indicators at this level:
A handover process exists, but it depends on people. The shift supervisor acts as the "gatekeeper" of equipment: they hand it out, collect it and log it. This creates two cascading problems. First, the supervisor becomes a bottleneck during shift changes, because every worker must wait for their intervention. Second, when the supervisor is unavailable (holiday, sick leave, role change), the process collapses and the plant temporarily reverts to Level 1.
Records exist but have gaps. In practice, sign-out sheets are filled in irregularly. A Gartner study on manual logging processes in industrial operations estimates that paper-based systems capture less than 40% of actual movements. Fridays, night shifts and production peaks are the moments where logging is abandoned first.
General trends can be spotted, but they are not acted upon. The operations manager knows that "a lot of PDAs go missing on the night shift" from experience, but cannot quantify it precisely or compare the trend month over month. The information lives in scattered sheets, not in a queryable system.
Benchmark: Plants at Level 2 improve asset availability to 65–75%, but real traceability (digitally recorded and auditable movements) remains below 35–40%.
What keeps plants trapped here: The false security of process. "We already have a log" equals "we already have control", even though the data says otherwise. The emotional investment of the supervisor who manages the process manually also generates resistance: proposing an alternative can be interpreted as pointing out that their work isn't effective.
The plant has replaced manual processes with an automated physical control system. Assets are stored in individual compartments with controlled access (PIN, QR, personal ID). Every collection and every return generates an automatic digital record with user, time, asset status and compartment.
Observable indicators at this level:
Shift handover is autonomous. The worker arrives, identifies themselves, collects their assigned equipment and starts working. There is no dependency on a supervisor or any manual process. Handover time drops from the typical 12–18 minutes at previous levels to under 2 minutes.
Traceability is 100% by design, not by discipline. It does not depend on someone filling in a sheet: the system records every movement as a prerequisite for opening a compartment. This eliminates the gaps of previous levels and makes it possible to know, at any given moment, who has each asset, since when and what condition it was in when collected.
Issues are detected in real time. If a worker returns a device with a low battery, damaged or outside its assigned compartment, the system generates an automatic alert. Defective equipment is removed from circulation immediately instead of travelling between shifts as a "landmine" — a recurring problem well documented in operational analysis of intralogistics inefficiencies.
Benchmark: Plants at Level 3 report asset availability at shift start of 95–100%, loss rates below 4% and a 60–70% reduction in operational costs associated with asset management.
What sets this level apart: Automation is not an incremental improvement on manual logging. It is a paradigm shift. At Level 2, data is a by-product of the process (generated only if someone logs it). At Level 3, data is the process (no movement can occur without a record).

The plant not only records and controls, but uses accumulated data to predict needs, anticipate incidents and optimise asset distribution proactively.
Observable indicators at this level:
Asset maintenance is predictive, not corrective. The system analyses the incident history per device and predicts when an asset will need servicing or replacement before it fails. Assets showing accelerated deterioration patterns are proactively removed from circulation.
Asset allocation is optimised by actual usage data. Instead of assigning the same number of devices to every shift, the system adjusts distribution based on historical demand. If the morning shift uses 30% more scanners than the night shift, allocation adapts automatically, reducing the need for replacement purchases.
Procurement is based on wear models, not on perception. The lifecycle history per asset type, shift and area allows the procurement manager to size orders with precision. It is no longer about "ordering 20 PDAs because it feels like we're short", but about "ordering 12 PDAs because the model shows 12 units will reach end of life within the next 90 days".
Reporting feeds strategic decisions. Asset management data stops being an operational report and integrates into executive dashboards. The total cost of ownership (TCO) of each asset type becomes visible and comparable, enabling informed investment decisions.
Benchmark: Plants at Level 4 are still a minority. According to McKinsey estimates on predictive maintenance adoption in industry, fewer than 15% of European plants operate with full predictive capabilities in operational asset management. However, those that do report additional reductions of 20–30% in replacement costs over Level 3.
How to get here: Level 4 is not a purchase; it is a consequence. It is reached when Level 3 has been running long enough to accumulate a critical mass of data. Columat Manager generates this history from day one of operation, so the transition from Level 3 to Level 4 is progressive and natural: the longer the system has been running, the more precise its prediction and optimisation capabilities become.
To make evaluation easier, these ten questions help place any plant within the maturity model. Each affirmative answer scores one point:
Interpretation: 0–2 points correspond to Level 1 (reactive). 3–4 points to Level 2 (procedural). 5–7 points to Level 3 (digitised). 8–10 points to Level 4 (predictive).
Most industrial plants score between 1 and 4. This is not a judgement — it is a starting point. What matters is that the jump from each level to the next has concrete levers and a quantifiable return on investment, as detailed in the sections above.
Regardless of where a plant sits today, the transition to the next level rests on three recurring levers:
Lever 1 — Make the cost visible. The biggest barrier to improvement is that the cost of manual asset management doesn't appear in any report. It is spread across procurement, unproductive hours, maintenance incidents and replacement overstock. The first lever is to calculate the plant's Physical Chaos Cost Index and present it to leadership as a single figure. Without this visibility, there is no budget.
Lever 2 — Remove the dependency on people. From Level 1 to Level 2, improvement depends on adding people to the process (supervisors who log). From Level 2 to Level 3, improvement depends on removing that dependency: replacing human control with a system where logging is automatic and handover is autonomous. This is the jump that has the greatest impact on indicators.
Lever 3 — Bridge the physical and the digital. Many plants have an excellent WMS, a sophisticated MES and a robust ERP. But the bridge between those systems and the actual physical control of operational assets does not exist. The third lever is to close that loop: ensuring that data about who has what, since when and in what condition reaches the central systems via API — not via the supervisor's email.
What is the difference between managing fixed assets and operational assets in a plant?Fixed assets (machinery, facilities) remain in a fixed location and are managed with traditional maintenance models such as ISO 55000. Operational assets (PDAs, scanners, PPE, tools) move between people and shifts, which demands per-user traceability and per-shift availability control. They are two distinct problems requiring distinct solutions.
How can I tell what maturity level my plant is at without a full audit?The 10-question self-assessment included in this article provides an initial evaluation in under 5 minutes. It does not replace a formal audit, but it places the plant at the right level and highlights priority improvement areas.
Do I need to go through every level, or can I jump from Level 1 to Level 3?You can jump directly from Level 1 to Level 3 with the right technology. In fact, it is the most efficient transition: it avoids investing in intermediate manual processes (Level 2) that have a very limited improvement ceiling. Smart Locker ecosystems make it possible to move from reactive to digitised management with no intermediate phase.
How long does it take to move from Level 3 to Level 4?Level 4 (predictive) requires a critical mass of historical data. With a digital control system in operation, the first useful predictive capabilities emerge after 6–9 months. Accuracy improves progressively as the volume of accumulated data grows.
What is the ROI of jumping from Level 2 to Level 3 in a mid-sized plant?Plants that move from manual management with paper logs to automated management report 60–70% reductions in operational costs related to assets. In a mid-sized plant with 150–200 devices in circulation, this translates to annual savings of €40,000 to €120,000, with a positive return on investment within the first 6–9 months.
Do Smart Lockers integrate with an existing WMS or MES?Yes. Smart Locker ecosystems with open APIs, such as Columat, connect to the plant's existing systems (SAP, Microsoft, ServiceNow, proprietary ERPs) without replacing them. They act as a physical control layer that feeds traceability and availability data into the WMS or MES in real time.